Distribution of Income from Ride-Hailing in Indonesia

By Richard Heeks, Treviliana Putri, Paska Darmawan, Amri Asmara, Nabiyla Risfa, Amelinda Kusumaningtyas & Ruth Simanjuntak
When a customer takes a taxi journey from a ride-hailing platform, where does the money go?
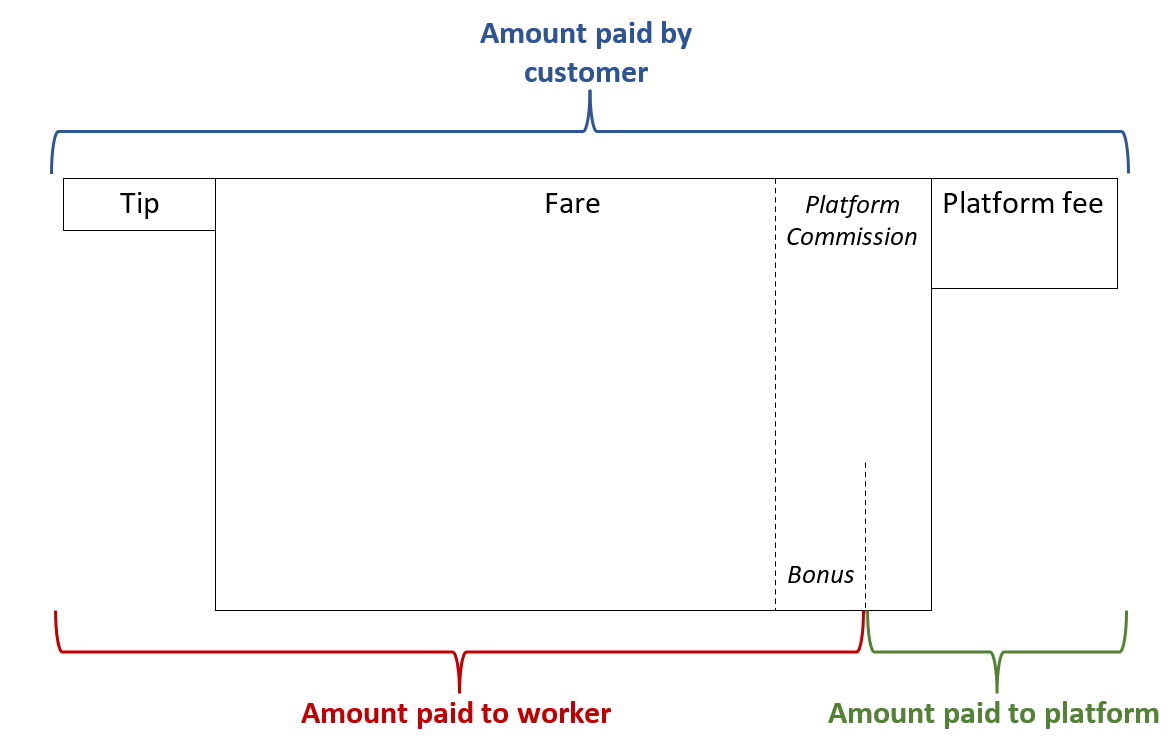
Using data gathered by the Fairwork Indonesia team in Jakarta, we can now break this down using the generic model shown below:
- Amount paid by customer: the fare for the ride plus a platform fee (sometimes called an order or service or transaction processing fee) plus – sometimes – a tip.
- Amount paid to platform: platforms typically take a commission (a set percentage of the customer fare, usually between 10-25%) and often also charge a platform fee.
- Amount paid to worker: all of the tip and the fare minus the platform’s commission. In some instances – at the end of a shift or at the end of a week – the worker might also get a bonus payment from the platform e.g. for completing a certain number of rides or being available for work consistently and/or at particular times of peak demand. There may also be other criteria that impact access to bonus payments such as low order cancellation rates or high customer feedback ratings. Bonuses are paid to the worker from the platform’s share which is taken from the platform’s commission; sometimes also from the platform fee; and in some instances more than this (in other words, in these cases, the worker earns more than the amount paid by the customer due to an additional subsidy taken by the platform from investment or other sources of capital).
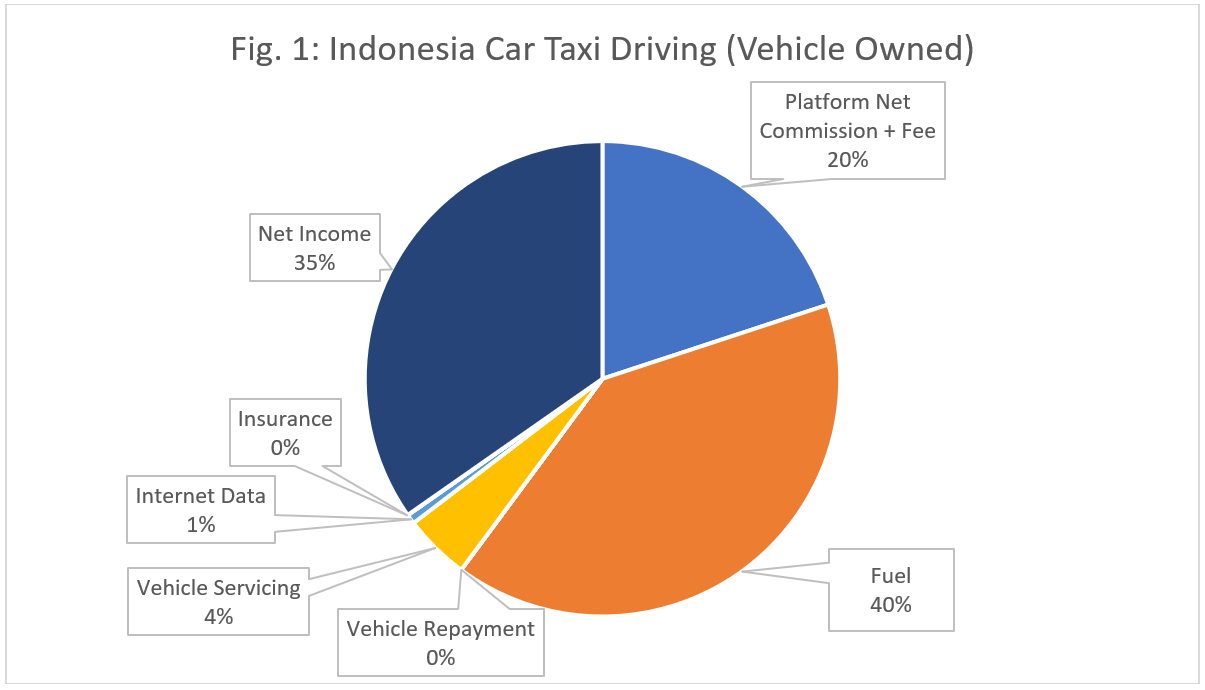
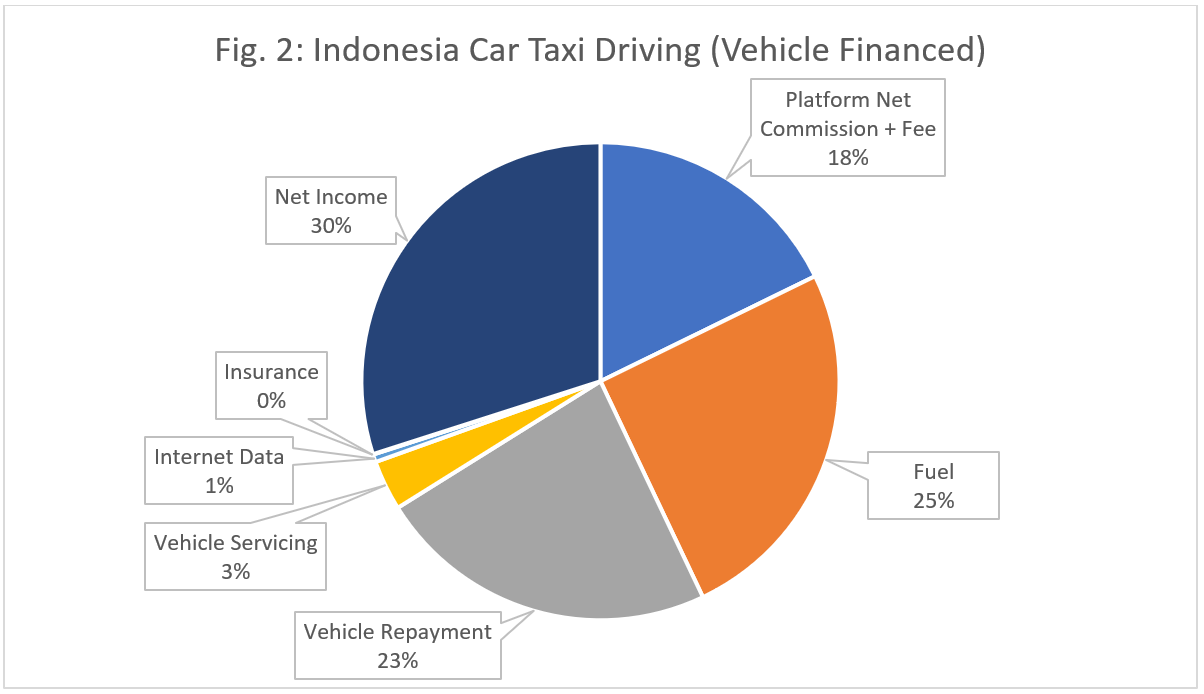
The two charts below show the distribution of customer payments for two car ride-hailing platforms (which were charging a 20% gross commission on the customer fare plus a fee). Figure 1 presents data for drivers who own their own vehicles (the minority of car taxi drivers in our sample). Figure 2 presents data for drivers who finance their vehicle through loan repayments or (less frequently) rental.
We can draw a number of conclusions:
- Worker Share of the Pie: the worker’s true net income (i.e. after work-related costs have been taken into account) is a minority share – around one-third – of the total payment made by the customer.
- Large Business Share of the Pie: aside from the net income earned by the worker, the great majority of the customer payment is captured by large private businesses; typically multinationals – the platform, fuel companies, vehicle finance houses, telecom providers. A significant chunk of vehicle servicing and maintenance costs even goes this way via parts, oil, tyres, etc.
- Fuel Costs: fuel makes up a very significant proportion of costs: around 90% of costs for vehicle owners, who spend more on fuel than they earn in net terms; about half of costs for those who finance their vehicle. It is therefore not surprising that the price of fuel is always at the forefront of workers’ minds: a relatively small rise can cause quite a significant reduction in their net income.
- Financing vs. Owning: not surprisingly, the net income of those who finance their vehicle is a lower proportion of customer payment than that of vehicle owners. In absolute terms, these two groups take home about the same net income. It’s not completely clear how this happens but one contributing factor is that workers who finance their vehicles work longer hours in order to help towards earning the extra to cover their repayments: an average 70-hour week compared to a 65-hour week for those who owned their cars.
Notes:
– Although insurance is shown as 0%, there are small payments against this item by some workers; just that they are so negligible a component that they rounded down to zero percent.
– The average figures we have included are that 15% of driver income is made up from tips and bonuses, of which tips make up 1.5% (i.e. one tenth of the extra). This must be seen as a very rough-and-ready average because platforms’ bonus payment schemes are continuously changing; their availability typically varies between workers (e.g. with tiered systems such that the highest bonus payments are only accessible by workers who meet particular criteria on workload, availability, cancellation rates, customer ratings, etc.); and workers’ ability to meet the targets necessary for bonus payment varies from day to day. Bonuses are typically also only achievable for those working very long shifts: some of our sample were working 15- and in a couple of instances 18-hour days.
– The figures here do not take into account any customer-side promotions that platforms occasionally run; the assumption being that these may not alter the share of driver income.
– Fairwork data from South Africa showed a similar financial distribution, with ride-hailing taxi drivers’ net income being 32% of the total customer payment. However, distribution of income will vary between platforms and locations so the figures above should be seen as illustrative rather than universal.